











Table of Contents
Bitcoin has traded roughly 50% below its all-time high for more than eight months, a prolonged stretch of weakness that may be a more revealing Bitcoin bear market signal than the size of the decline itself.
As of June 25, 2026, Bitcoin is trading around $61,651, approximately 51% below its October 6, 2025 peak near $126,000. The ongoing Bitcoin correction has now lasted 262 days, placing the market in one of its longest post-peak retracement periods since institutional adoption accelerated through spot Bitcoin ETFs.
The extended period of Bitcoin below all-time high levels is becoming one of the defining characteristics of the current cycle. While previous Bitcoin bear markets were defined by steep price collapses, the current downturn appears increasingly characterized by something different: time.
How Long Bitcoin Bear Markets Last
Bitcoin’s major market cycles have consistently required years to recover previous peaks:
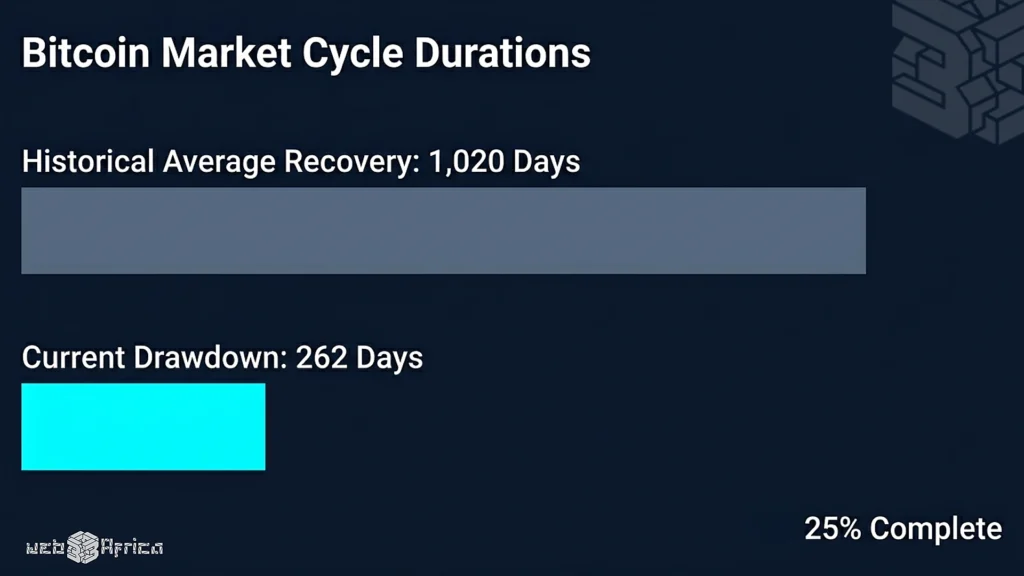
Across the three completed cycles, Bitcoin spent an average of approximately 1,020 days below its previous all-time high before fully recovering.
RELATED: Bitcoin Forecast Suggests 30% Rally, But Risks Remain
Viewed through that lens, today’s drawdown remains relatively young. The current recovery period has lasted only about one-quarter of the average historical timeline.
That perspective challenges a common assumption among newer market participants that a recovery should occur within months rather than years.
The Impact of Institutional Capital on Current Market Structure
The current bear market is unfolding under conditions that did not exist during earlier Bitcoin cycles.
Most notably, the market now includes institutional ownership through Bitcoin ETFs based in the U.S.
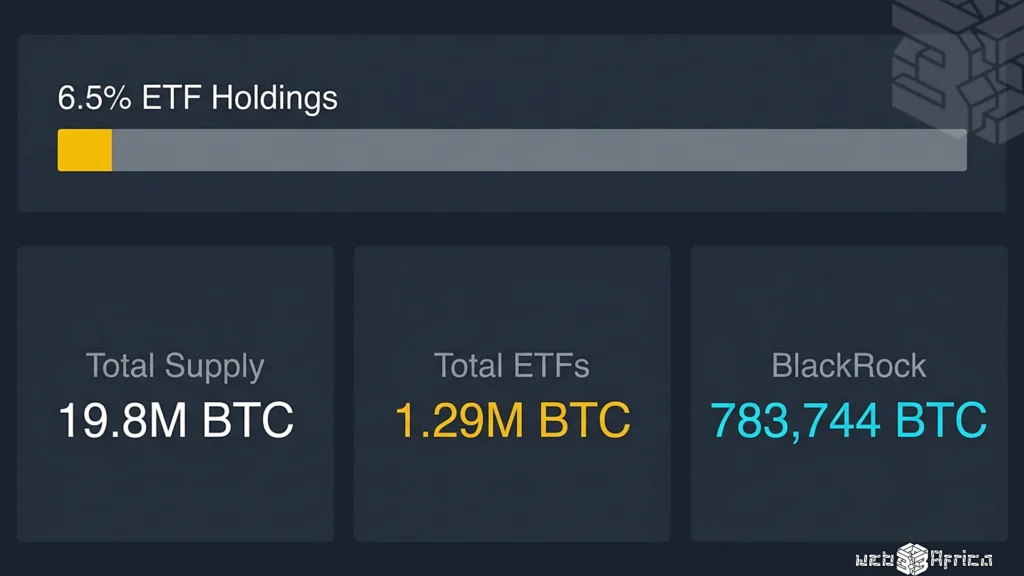
BlackRock’s iShares Bitcoin Trust reported holding 783,744 BTC at the end of the first quarter of 2026, while ARK Invest estimated total U.S. spot Bitcoin ETF holdings at approximately 1.29 million BTC. Collectively, ETF products now control a meaningful share of circulating supply, fundamentally changing how capital moves through the market.
Yet institutional participation has not eliminated volatility.
CoinShares reported $1.438 billion in weekly outflows from Bitcoin investment products in early June, marking the largest weekly outflow of 2026. Earlier in the year, U.S. spot Bitcoin ETFs recorded substantial net redemptions as investor sentiment weakened.
The result is a market structure that appears different from previous cycles. Instead of the rapid 80% to 85% crashes that characterized retail-driven downturns, Bitcoin is experiencing a shallower but more prolonged correction.
Forecasting the New Rhythm of Institutional Crypto Cycles
Some market researchers believe the traditional four-year Bitcoin cycle may be evolving.
Fidelity Digital Assets has argued that deeper liquidity, broader institutional participation, and maturing market infrastructure could alter the pattern investors have become accustomed to over the past decade.
RELATED: Crypto Price Predictions Decoded: Expert Analysis of the 2024-2025 Market Cycle
Rather than producing extreme boom-and-bust cycles, institutional ownership may compress drawdown severity while extending recovery periods.
That possibility helps explain why Bitcoin remains trapped within a relatively narrow range despite substantial selling pressure.
Glassnode’s on-chain analysis has repeatedly described Bitcoin as rangebound between $60,000 and $70,000, with significant overhead supply remaining between current prices and previous highs.
Markets often require time to absorb that supply, particularly when large holders distribute positions gradually rather than capitulating all at once.
Examining the Macroeconomic Pressures Affecting Digital Assets
The U.S. effective federal funds rate remains near 3.63%, reflecting a monetary environment that remains restrictive compared with the ultra-loose conditions that fueled earlier crypto bull markets.
Research from BlackRock has highlighted Bitcoin’s sensitivity to real interest rates. When yields remain elevated, investors can generate returns from traditional assets without taking the volatility associated with cryptocurrencies.
At the same time, strong performance in artificial intelligence-related equities has attracted capital that might otherwise have flowed into digital assets.
The combination of higher rates, risk-off positioning, and competing investment opportunities continues to create headwinds for Bitcoin.
Comparing the Current Drawdown to Historical Bitcoin Cycles
Historically, not yet.
While a 51% decline may appear severe, the duration of the current drawdown remains significantly shorter than previous recovery cycles.
The current cycle offers one of the clearest modern case studies, with Bitcoin spending more than eight months trading roughly half its peak value.
What makes the present environment unusual is not the length of time below all-time highs but the fact that it is occurring after the arrival of large-scale institutional adoption.
For years, analysts argued that ETFs and institutional capital would reduce volatility and create a more stable market. Instead, the current cycle suggests institutions may be changing the shape of Bitcoin’s downturns rather than eliminating them altogether.
Identifying Crucial Support Zones for Digital Asset Allocators
Analysts continue to monitor the area around Bitcoin’s realized price, which ARK estimates near $54,000.
Historically, realized price has often served as an important support zone during late-stage bear markets because it represents the average acquisition cost of market participants.
RELATED: Crypto Price Predictions Decoded: Expert Analysis of the 2024-2025 Market Cycle
A sustained move below that level could signal further weakness, while successful support may strengthen the case that the market is moving toward a long-term bottoming phase.
Glassnode data also shows long-term holders have been realizing losses of roughly $200 million per day since November 2025, suggesting distribution pressure remains present even after months of weakness.
Potential Market Catalysts for a Digital Asset Recovery
Several catalysts could help Bitcoin break out of its prolonged recovery period:
- Renewed spot Bitcoin ETF inflows
- Lower interest rates and improving liquidity conditions
- Increased institutional allocations
- Reduced selling pressure from long-term holders
- Broader risk appetite across global markets
Whether those catalysts emerge in the coming months remains uncertain.
The Clock Matters as Much as the Chart
Bitcoin’s current position, roughly 50% below its all-time high after 262 days, may feel painful for investors focused solely on price.
For now, the market remains caught between two competing narratives. One that expects history to repeat itself and another that believes institutional adoption is reshaping Bitcoin’s cycle structure.
The current Bitcoin bear market remains relatively young compared with previous cycles, suggesting investors may need to pay as much attention to time as they do to price. Until the market provides a definitive answer, the clock may matter just as much as the chart.
FAQ
-
Is the current Bitcoin bear market different from previous cycles?
Yes. While previous Bitcoin bear markets were often marked by sharp price declines, the current cycle has been characterized by a prolonged recovery period. The article argues that institutional ownership through spot Bitcoin ETFs may be changing the shape of market downturns by reducing the severity of price crashes while extending the time needed to recover previous highs.
-
How long do Bitcoin bear markets usually last?
Historical data shows Bitcoin has typically spent around 1,020 days below its previous all-time high before reaching a new peak. Compared with those cycles, the current drawdown of 262 days remains relatively early despite lasting more than eight months.
-
What could signal the end of the current Bitcoin bear market?
Potential catalysts include renewed spot Bitcoin ETF inflows, improving global liquidity, lower interest rates, stronger institutional demand, and reduced selling pressure from long-term holders. A sustained move above key resistance levels would also strengthen the case for a broader recovery.
Discover more from Web3Africa
Subscribe to get the latest posts sent to your email.

You must be logged in to post a comment.