










Table of Contents
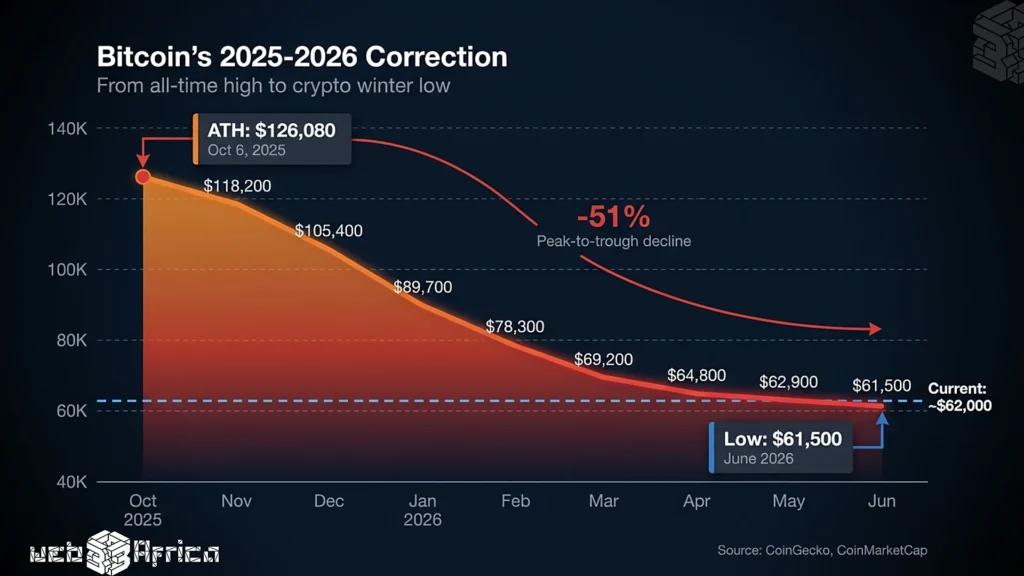
Bitcoin’s 51% decline from its October 2025 all-time high of $126,080 to its June 2026 low of $61,500 has persisted for eight months, with the underlying cause remaining contested between macroeconomic liquidity tightening, institutional rotation into AI equities, and geopolitical risk-off flows.
The digital asset now trades near $62,000, half its $126,198 peak. Yet the correction defies easy categorization. Is this a crypto winter driven by sector-specific weakness or a liquidity-driven crypto correction reflecting tighter global capital conditions?
The answer matters because it determines what comes next.
Yet the most compelling evidence suggests the question itself may be outdated. A closer examination of monetary aggregates, institutional flows, and market microstructure reveals something more nuanced. Bitcoin is undergoing a structural transformation in how it responds to macro conditions, and the old frameworks no longer fully capture the transmission mechanism.
The Central Anomaly
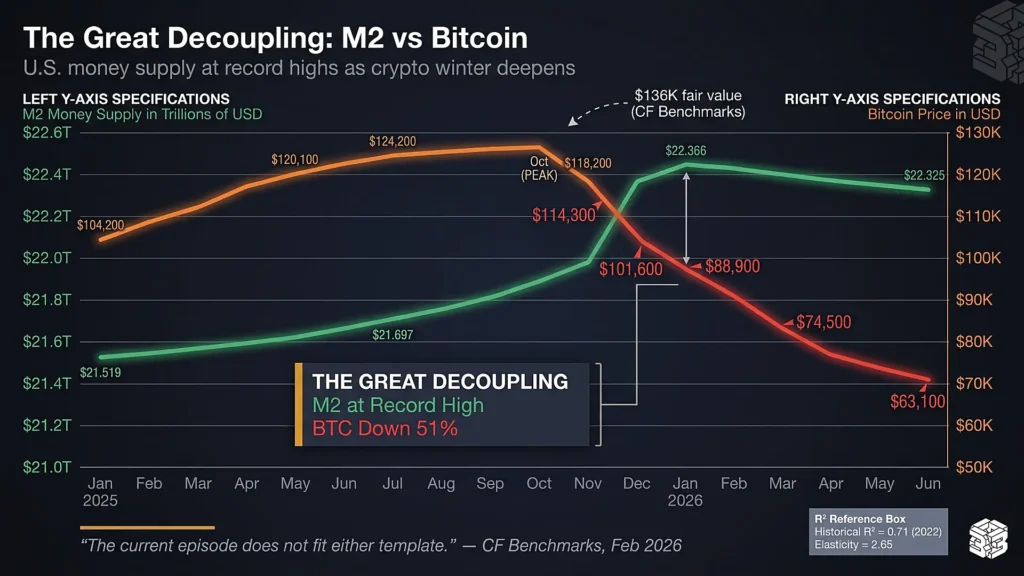
Here is the data point that should reshape the conversation. The U.S. M2 money supply reached a record $22.442 trillion in January 2026, and global liquidity has expanded by more than 10% year-over-year. Yet Bitcoin has fallen sharply throughout the same period.
This decoupling is historically unusual. In 2022, when M2 contracted by 2.7% amid aggressive Federal Reserve quantitative tightening, Bitcoin fell 52.4%, a move consistent with its historically high correlation to global liquidity during periods of monetary contraction.
RELATED: Bitcoin Is No Longer Crashing for Crypto Reasons
This is consistent with its high sensitivity to liquidity conditions. The statistical relationship showed that Bitcoin’s correlation with M2 carried an R-squared of 0.71, meaning monetary conditions explained roughly 71% of Bitcoin’s variance during that window.
CF Benchmarks, in a February 2026 analysis, noted the divergence plainly:
“The current episode does not fit either of those templates. M2 is expanding, yet Bitcoin is declining.”
Academic research published in 2025 estimated Bitcoin’s long-run elasticity to M2 at 2.65, meaning a 1% increase in money supply should, over time, correspond to a 2.65% rise in Bitcoin’s price. The mechanism has broken down or, at minimum, been overwhelmed by other forces.
That breakdown is the analytical heart of the debate over whether crypto winter is caused by global liquidity tightening or something else entirely.
Wall Street ETFs Rewrote the Rules of Crypto Price Discovery
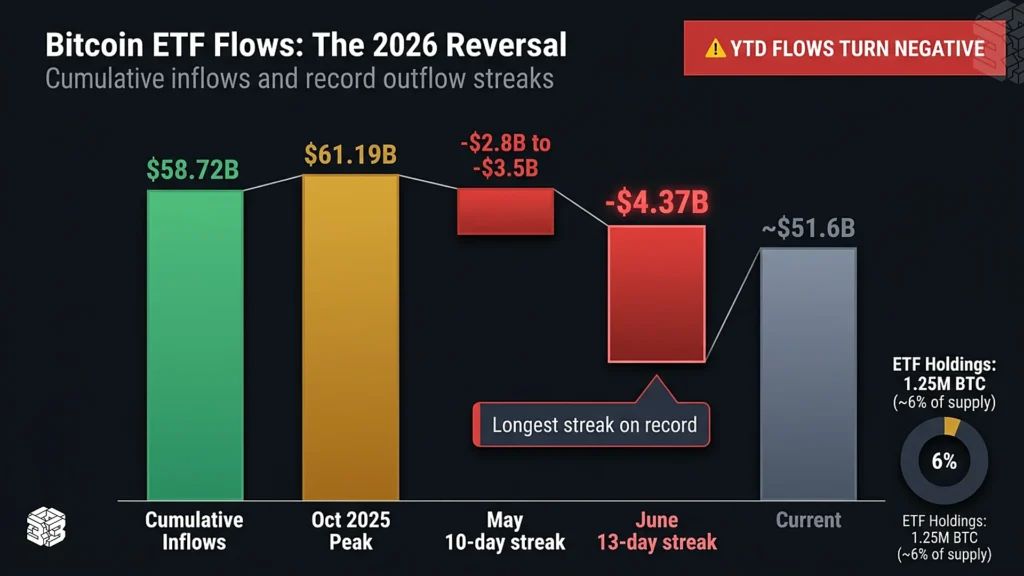
The most significant structural shift in Bitcoin markets over the past two years has been the rise of U.S. spot exchange-traded funds. Approved in January 2024, these products have accumulated $58.72 billion in cumulative inflows and now hold 1.25 million BTC, roughly 6% of circulating supply.
More importantly, ETFs have changed who sets Bitcoin’s marginal price. Goldman Sachs data confirms that by late 2025, the three-month correlation between Bitcoin ETFs and non-profitable technology stocks reached 0.78, marking the 97th percentile since December 2014 and indicating that Bitcoin had become tightly coupled with speculative growth equities rather than functioning as an uncorrelated asset.
RELATED: How Institutional Capital is Rewiring the Traditional Bitcoin Bear Market Cycle
With over $123 billion in ETF assets by year-end, Bitcoin’s price discovery increasingly reflects the preferences of traditional portfolio allocators, not crypto-native traders.
This flow-regime shift matters because institutional allocators respond to a different set of signals than offshore derivatives markets. Risk budgets, rebalancing rules, Treasury yields, and equity volatility now drive marginal demand in ways that offshore perpetual swaps and unregulated lending platforms once did.
When macro uncertainty rises, as it has under new Federal Reserve Chair Kevin Warsh, sworn in May 22, 2026, institutional capital rotates toward quality and liquidity. That rotation shows up as sustained ETF outflows.
The data backs this up. Bitcoin ETFs experienced two record outflow streaks in 2026. A 10-session window in May draining roughly $2.8 billion to $3.5 billion, followed by a 13-day streak in June pulling another $4.37 billion. Combined, these episodes pushed year-to-date cumulative flows into negative territory for the first time.
The first outflow streak was triggered by the May 12 CPI print, which showed reaccelerating U.S. inflation tied to Middle East energy shocks. The timing shows how Bitcoin responds to traditional macro catalysts, inflation data, Fed policy signals, and geopolitical risk through an institutional transmission channel that did not exist in prior cycles.
Decoding the Conflicting Signals Inside Global Liquidity Conditions
Global liquidity conditions in 2026 present a contradictory picture.
On one hand, system-wide monetary aggregates remain elevated. U.S. M2 sits near all-time highs. Bank for International Settlements data shows international credit to non-banks has risen to roughly 38% of global GDP. Research from CrossBorder Capital’s Michael Howell projects the Global Liquidity Index approaching a cyclical peak near 70 (on a 0–100 scale) by mid-2026, up from a recent reading of 47.9.
RELATED: How Institutional Capital is Rewiring the Traditional Bitcoin Bear Market Cycle
On the other hand, financial conditions have tightened. Treasury yields rose sharply in the first half of 2026. The IMF’s April Global Financial Stability Report noted that while market liquidity has not materially deteriorated, conditions have grown less accommodative since February, driven by higher energy prices and geopolitical tensions.
Short-term liquidity measures have weakened. Data from BGeometrics showed global M2 seven-week growth turning negative in March 2026.
These conflicting signals help explain the analytical confusion. Liquidity borderlines on a spectrum of conditions ranging from central bank balance sheets to credit availability to market depth. Bitcoin appears sensitive to changes in the second derivative, the rate at which liquidity is expanding, rather than the absolute level.
Howell’s research, drawing on weekly data from 2017 to 2025, estimates that roughly 50% of Bitcoin’s systematic variance is explained by global liquidity, with gold and investor sentiment accounting for the rest. But that leaves half of Bitcoin’s movement unexplained by liquidity alone.
LeverageShares’ analysis of the Global Liquidity Index over a decade confirms that while Bitcoin generally tracks liquidity, the correlation “exists, but it expands and contracts through time.” Since Bitcoin’s October peak, the two have diverged sharply, liquidity rising and Bitcoin falling.
Similar breakdowns occurred in 2019, 2020, 2022, and 2024. The lesson is that liquidity is a powerful background condition, not a deterministic driver.
The Crypto-Specific Factors
Even if macro liquidity were unambiguously supportive, Bitcoin faced headwinds particular to digital assets in 2026.
First, the post-halving supply shock appears to have been absorbed more slowly than in prior cycles. The April 2024 halving reduced miner issuance by half, but by late 2025, the marginal impact on net supply had faded. Historical analysis from K33 Research notes that Bitcoin’s 2022-to-2025 rally delivered roughly a 5x gain, far less than the 20x moves of 2017 and 2021. A less parabolic advance, the firm argues, may produce a proportionally shallower correction.
Second, leverage was unwinding. On-chain data from late February 2026 showed Bitcoin’s Net Unrealized Profit/Loss (NUPL) metric at just 19%, consistent with holder losses and deleveraging. Funding rates for perpetual futures remained negative for a record 81 consecutive days through May, signaling persistent selling pressure from leveraged positions.
Third, capital rotated into competing narratives. While Bitcoin corrected, U.S. equity markets rallied on artificial intelligence optimism, with semiconductor and cloud-computing stocks absorbing institutional flows that might otherwise have supported digital assets.
None of these factors, individually, constitutes a crypto winter in the structural sense. There have been no exchange collapses, no major stablecoin depegs, and no systemic credit failures. But collectively, they created an environment where Bitcoin struggled even as system-wide liquidity remained elevated.
What Institutions Are Actually Doing
Despite the drawdown, institutional holders have not capitulated.
21Shares, in its mid-year 2026 report, noted that while global crypto exchange-traded product assets under management declined roughly 15%, the drop was driven largely by falling prices, not redemptions. Bitcoin holdings in ETPs stood at 1.25 million coins in May, just 8% below all-time highs.
Eliezer Ndinga, Head of Research at 21Shares, emphasized the point:
“The current drawdown is far milder than the 80%+ corrections of previous cycles, and Bitcoin has continuously stayed above its aggregate investor cost basis of $54,000. These are signs of a more mature market with stickier capital flows.”
Adrian Fritz, Chief Investment Strategist at the firm, added:
“What stands out at this mid-year mark is the profound resilience of institutional capital. Allocators are holding through volatility.”
This behavior contrasts sharply with prior bear markets, when exchange outflows, miner capitulation, and forced liquidations dominated. In 2026, the focus has been concentrated in corporate treasury holdings. Roughly 200 public companies now hold a combined 1.28 million BTC, but that stack is worth only $100 billion against a $250 billion target, forcing distressed sales. Nakamoto Holdings, for example, liquidated Bitcoin at a roughly 40% loss, with its shares down 99% from 2025 highs.
The divergence between sticky institutional ETF capital and distressed corporate treasury sales suggests a bifurcated market. Long-term allocators treating Bitcoin as a strategic holding, and leveraged entities forced to de-risk.
Comparing the 2026 Correction to Previous Digital Asset Bear Markets
Comparing 2026 to prior Bitcoin bear markets reveals both similarities and critical differences.
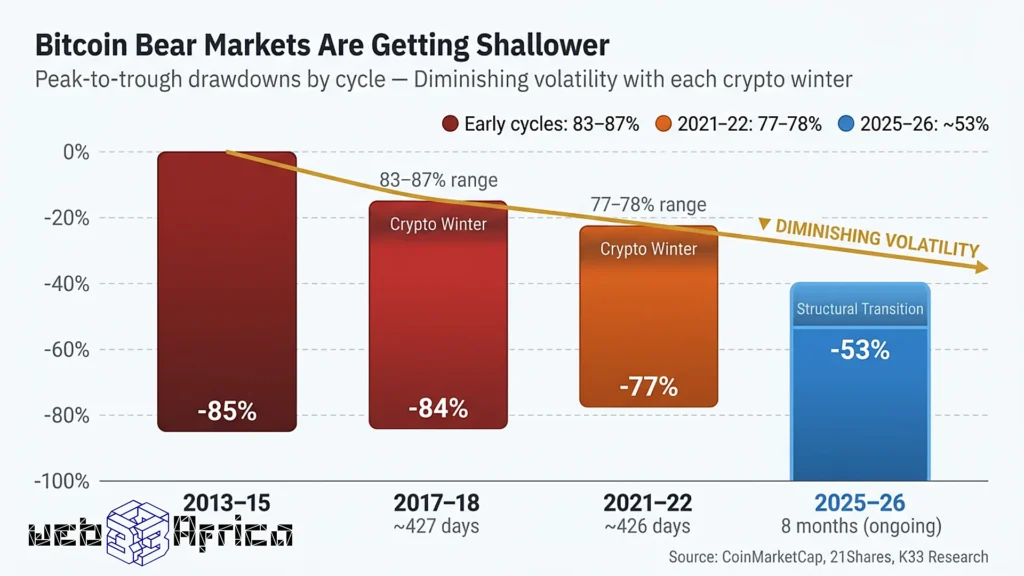
The 2017–2018 crypto winter saw an 83–87% drawdown over roughly 427 days, driven by ICO regulatory crackdowns and retail exhaustion. The 2021–2022 cycle produced a 77–78% decline over 426 days, amplified by Federal Reserve tightening, the Terra/Luna collapse, and the FTX failure.
The current correction, at roughly 53% over eight months, is milder in magnitude but comparable in duration.
More importantly, the structure of the decline differs. Previous bear markets featured capitulation events. Bitcoin traded well below its realized cost basis; on-chain metrics showed mass holder losses, and new capital formation collapsed.
In 2026, Bitcoin has not breached its aggregate cost basis of roughly $54,000, funding has remained available for quality projects, and institutional infrastructure continues to expand.
21Shares highlighted “continued institutional participation through new product launches,” including early inflows into Hyperliquid-linked ETFs, which gathered $150 million in their first month.
Three Mental Models
To frame the current environment, consider three scenarios:
Liquidity Winter
Bitcoin’s decline reflects tightening financial conditions, higher real yields, dollar strength, and reduced risk appetite, transmitted through institutional flows. Recovery depends on Federal Reserve policy easing its grip on regulation. Arthur Hayes, co-founder of BitMEX, holds this view, projecting a $40,000 bottom within six months and citing a hawkish Fed, where traders price December rate-hike odds near 37%.
Crypto Winter
The correction stems from sector-specific exhaustion, post-halving cycle completion, leverage unwind, waning retail interest, and capital rotation into AI equities. Recovery depends on crypto-native catalysts such as new narratives, protocol innovations, and on-chain accumulation.
RELATED: Digital Nomads, DeFi, and Dreams: Inside Cape Town’s Booming Crypto Scene
Structural Transition
Bitcoin is maturing into a macro asset whose price is set by institutional risk budgets, not purely by crypto fundamentals or broad M2. Bitcoin trades as a high-beta, non-yielding exposure within multi-asset portfolios, sensitive to equity volatility, credit spreads, and positioning flows. The CF Benchmarks finding, M2 expanding yet Bitcoin declining, fits this model the best.
Identifying the Key Catalysts That Will Determine the Next Market Move
Three catalysts could shift the trajectory:
Monetary policy clarity. If the Federal Reserve under Kevin Warsh signals a definitive pause or pivot, particularly if inflation moderates and growth slows, financial conditions could ease, supporting ETF inflows.
On-chain capitulation. If Bitcoin breaks below its $54,000 cost basis and tests the $50,000–$55,000 range projected by analysts including CryptoQuant and 10x Research’s Markus Thielen, it may flush out remaining weak holders and establish a durable bottom.
RELATED: The Whale, The Sell-Off, and $2B: Inside November’s Crypto Liquidation
Equity market stress. A correction in AI-related technology stocks could trigger broader risk-off conditions, but paradoxically, it might also end the capital rotation away from crypto and rebalance portfolio flows.
What remains unresolved is whether Bitcoin’s long-run elasticity will reassert itself or whether the institutional flow regime has permanently altered the transmission mechanism.
The answer will determine whether this correction is remembered as a crypto winter, a liquidity-driven reset, or the moment Bitcoin fully transitioned from a speculative retail asset into a macro-sensitive institutional holding.
FAQ Section
What is a crypto winter?
A crypto winter is a prolonged period of falling cryptocurrency prices accompanied by weaker investor sentiment and reduced market activity. This article argues that Bitcoin’s current downturn differs from previous crypto winters because institutional capital and ETF flows have become much larger drivers of price action.
Is the current crypto winter caused by global liquidity?
Not entirely. Although global liquidity remains historically high, Bitcoin has continued to decline. The article concludes that tighter financial conditions, institutional portfolio rebalancing, and ETF outflows have weakened Bitcoin’s traditional relationship with expanding money supply.
Why is Bitcoin falling despite record global liquidity?
The article identifies several factors, including sustained Bitcoin ETF outflows, higher Treasury yields, institutional rotation into AI-related equities, leverage unwinding, and geopolitical uncertainty. Together, these have outweighed the supportive effects of higher global liquidity.
How have Bitcoin ETFs changed the crypto market?
Spot Bitcoin ETFs have shifted price discovery toward traditional financial markets. Institutional investors increasingly influence Bitcoin through portfolio allocation decisions, interest rate expectations, equity market performance, and macroeconomic risk management rather than crypto-native trading activity.
Is this Bitcoin correction different from previous bear markets?
Yes. Unlike earlier crypto winters marked by exchange failures and widespread capitulation, the current correction has occurred while institutional participation remains relatively resilient and Bitcoin continues trading above its aggregate investor cost basis.
Discover more from Web3Africa
Subscribe to get the latest posts sent to your email.
You must be logged in to post a comment.