











In Brief
-
Bitcoin price drop of 52% from the October 2025 peak reached a local bottom of $60,057.44 on February 6, 2026.
-
The “Great Deleveraging” was catalyzed by Hong Kong hedge funds unwinding Yen-funded carry trades following Bank of Japan rate hikes.
-
Algorithmic “negative gamma” selling by major investment banks created a liquidity air pocket below $78,700.
-
Miner capitulation intensified as total breakeven costs reached $72,700, forcing a pivot toward AI infrastructure.
February started off with crypto traders worldwide panicking at the 52% Bitcoin price drop. On February 6, 2026, the pillar of the crypto market (Bitcoin) plunged to $60,057.44.
As of the time of writing, BTC has recovered only slightly to $69,047, but the damage to positioning and liquidity had already been done.
So, why the sudden drop? What caused a $100K-plus asset to lose more than half its value to a point? Expert analysts term the event as the “Great Deleveraging of 2026.” Here are a few scenarios analysis suggests caused the massive Bitcoin price drop.
When Bitcoin’s Rally Turned to Rout
The carnage was swift and brutal. On-chain data from Glassnode showed realized losses averaging $1.26 billion per day over the crash week, with a single-day peak of $889 million on February 6. Levels unseen since the FTX collapse in November 2022.
Subsequently, the crypto market crash erased approximately $570 billion in value across the board, as Bitcoin broke through critical support levels including the short-term holder cost basis and yearly open price.
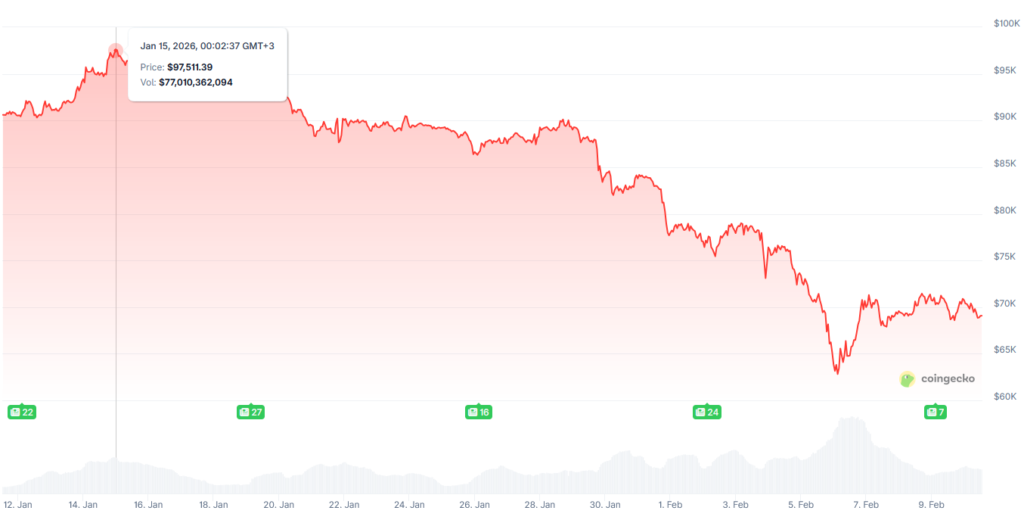
Unlike previous flash crashes primarily driven by leverage liquidations, persistent spot Bitcoin ETF outflows characterized this decline. U.S. Bitcoin ETFs hemorrhaged $3 billion in January 2026 alone, following $7 billion and $2 billion in outflows during November and December 2025. The Fear and Greed Index plummeted to 12 points, signaling “extreme fear” among traders.
RELATED: A False Sense of Security as Africa’s Prominent Distributor Challenges Bitcoin ETF Narrative
Why is bitcoin falling? Five theories that fit the evidence
No single headline (a whale, a rumor, one regulatory comment) explains the magnitude and speed. The best read is a “perfect storm” of five interconnected pressures.
The yen carry trade unwind (Hong Kong liquidity shock)
Hong Kong hedge funds utilizing Japanese yen as cheap funding currency ($0.75% rates from the Bank of Japan) built massive leveraged positions in Bitcoin call options, particularly on BlackRock’s IBIT ETF.
When Japan raised rates to 0.75% in late January 2026 and the yen strengthened against the dollar, these funds faced a devastating squeeze, higher debt costs, and swelling principal obligations.
Parker White of DeFi Development Corp. identified the $900 million in IBIT options premiums traded on February 6 as evidence of forced unwinding. The Coinbase Premium, measuring the BTC/USD versus BTC/USDT price differential, hit -$167.8, the most negative reading in over a year, confirming U.S. institutional selling dominated the selloff.
Negative‑gamma dealer hedging from structured products
Former BitMEX CEO Arthur Hayes pinpointed structured products as the crash accelerant. Investment banks like Morgan Stanley issued “structured notes” to wealthy clients with downside protection barriers. When Bitcoin broke through the critical $78,700 threshold, dealers entered “negative gamma.” Typically, it’s a regime where risk models force them to sell into falling prices to maintain hedges.
This created an algorithmic feedback loop; selling triggered more selling, generating an “air pocket” in liquidity that vaporized buy-side support between $70,000 and $60,000. The basis trade yield, which drove hedge fund ETF inflows, collapsed from 17% in 2024 to below 5% by February 2026, eliminating arbitrage incentives. CoinShares estimated hedge fund Bitcoin exposure dropped by one-third during this period.
Crypto Price Predictions Decoded: Expert Analysis of the 2024-2025 Market Cycle
Miner capitulation driven by a pivot toward AI infrastructure
The Bitcoin network’s hash rate plummeted 10-40% as miners faced an existential crisis. With electricity costs alone averaging $58,160 per Bitcoin and total break-even costs reaching $72,700, mining became unprofitable below $70,000. Simultaneously, the AI boom offered miners lucrative alternatives such as retrofitting facilities for high-performance computing.
Cango Inc. sold 4,451 BTC (approximately $305 million) in a single transaction to fund its AI transition and pay down debt. Riot Platforms liquidated $161 million in Bitcoin for similar strategic pivots. This industrial capitulation created constant sell pressure that capped every attempted rally.
Miners were simply reallocating capital under economic pressure, turning BTC treasuries into a funding source.
A hawkish macro shock (Fed pause + Warsh) and cross‑asset margin calls
The January 28, 2026, FOMC meeting shattered rate-cut expectations when the Fed held at 3.50%-3.75%, with Chair Powell citing “stabilizing” labor markets and “elevated” inflation. Two days later, President Trump’s nomination of Kevin Warsh, a notorious “sound money” hawk, as the next Fed Chair triggered violent cross-asset liquidation.
Bitcoin as a Reserve Currency: Africa’s Financial Future or a Volatile Gamble?
Gold plunged 12% and silver crashed 37% in a single day as markets repriced liquidity expectations. Bitcoin moved in lockstep with risk assets, showing a 0.90 correlation to Nasdaq during May-June 2025 and a 0.73 correlation to the S&P 500 after Trump’s April tariff announcement. Traders facing margin calls on precious metals positions used Bitcoin’s 24/7 liquidity as a cash source, deepening the selloff.
Essentially, BTC acted as a high‑beta liquidity vehicle when real rates bit.
The Policy Paradox: Promises Without Action
The 2025 rally was predicated on the “United States Bid”, expectations that the government would actively accumulate Bitcoin for its Strategic Reserve. Reality proved disappointing. Patrick Witt, the Director of the President’s Council of Advisors for Digital Assets, acknowledged that obscure and complex legal provisions had “stalled” the Strategic Bitcoin Reserve.
RELATED: Bitcoin Price Dip: A Blessing or Disaster for African Investors?
The March 6, 2025, Executive Order merely directed that 198,000 BTC of seized assets “shall not be sold,” eliminating a supply overhang but providing no new demand. When traders realized the government wasn’t buying, only holding confiscated coins, front-running positions unwound violently. Deutsche Bank cited “stalled regulatory momentum” as a key crash driver despite the ostensibly pro-crypto political environment.
The Ripple Effect: Kickstarting a Crypto Market Crash
The crypto market crash didn’t punish all assets equally. While the Bitcoin price drop reached an all-time low, it was by no means sudden. From January 17, a steady decline is visible throughout BTC and major altcoins.
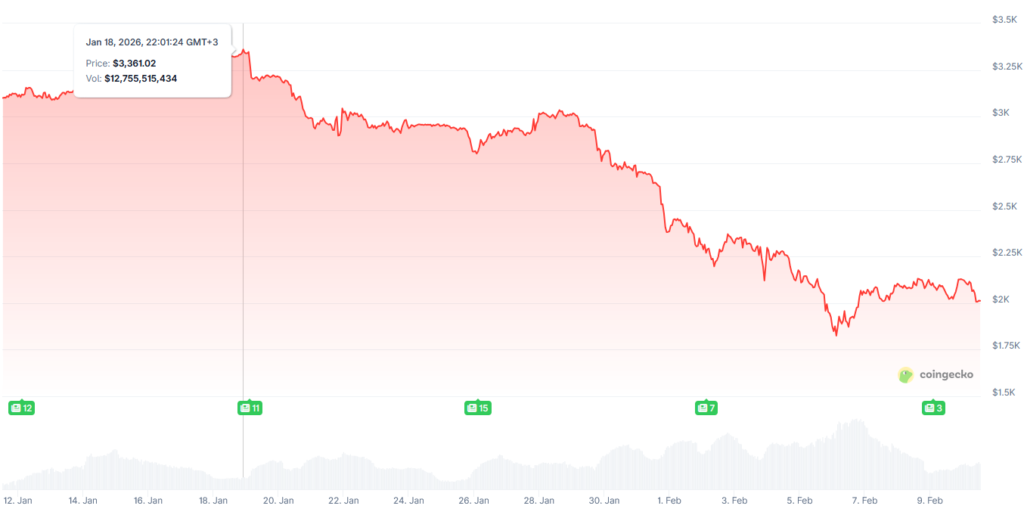
Ethereum suffered most severely among major cryptocurrencies, falling over 53% from highs, worse than Bitcoin’s 52% drawdown. ETH’s identity crisis, lacking Bitcoin’s “digital gold” narrative or Solana’s “high-speed casino” appeal, left it vulnerable to indiscriminate institutional selling.
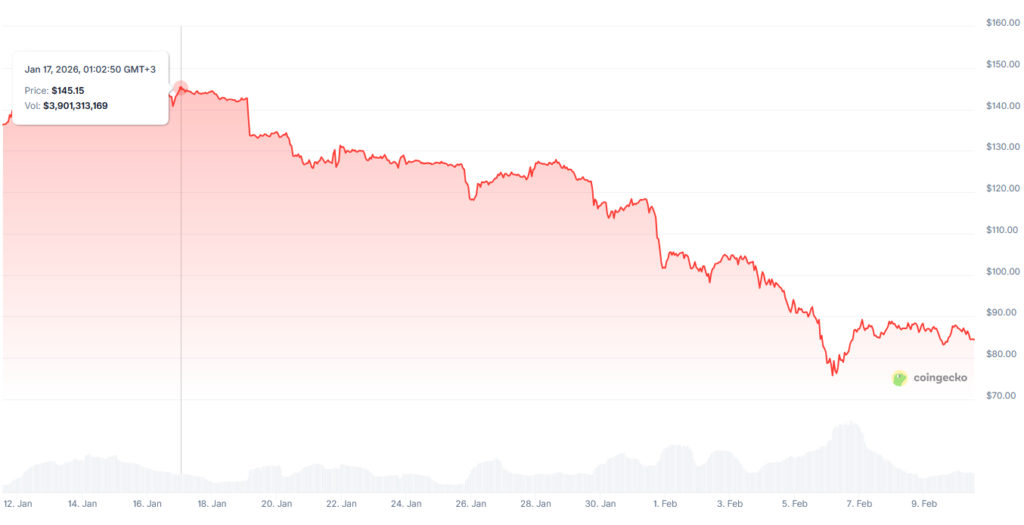
Solana dropped over 12% in the final crash days and has dropped by at least 46% since the steady slope from January 17th. Yet the altcoin demonstrated ecosystem resilience. January 2026 stats show Solana DEX volume topped $117.7 billion, outpacing Ethereum, suggesting fundamental usage remained sticky despite price weakness.
BNB suffered a similar fate but not as severe, going down by at least 35% since January 2026 and dropping only by 12% during its final days. According to some experts, BNB was supported by Binance’s mechanized burn program that accelerates supply reduction during high-volatility periods.
This Winter vs. Previous Crashes
The current bitcoin price drop, while severe, appears moderate compared to historical crypto winters:
-
2017-2018 Winter: Peak of $19,000 to trough of $3,200 = 85% decline
-
2021-2022 Winter: Peak of $69,000 to trough of $16,000 = 77% decline
-
2025-2026 Winter: Peak of $126,000 to low of $60,000 = 52% decline (potentially incomplete)
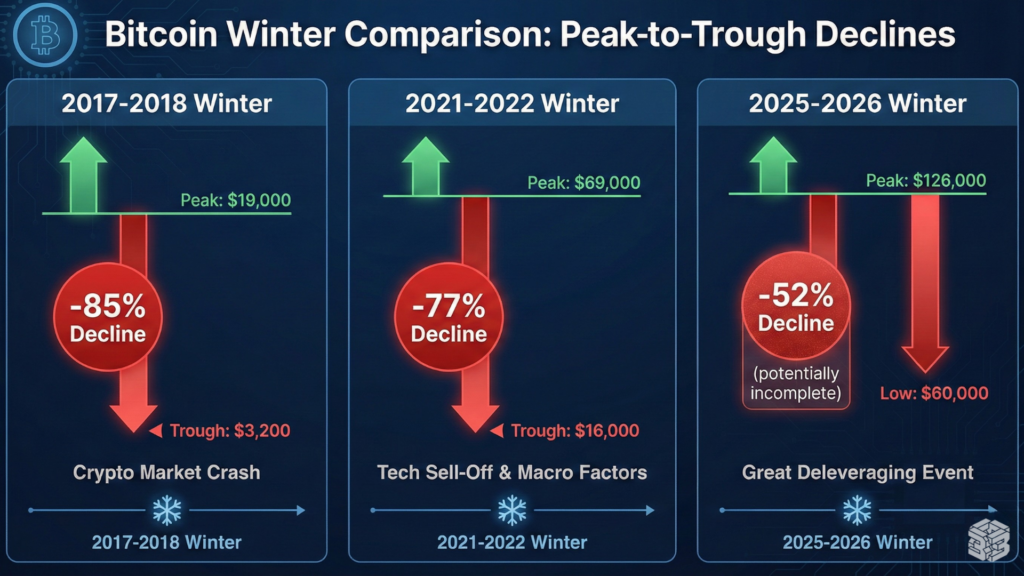
However, structural differences matter. Previous crashes were retail-driven sentiment collapses. The 2026 crash represents institutional machinery failure and the unwinding of basis trades, gamma hedging, and carry trades. Bitcoin’s correlation with traditional markets (54.4% annualized volatility versus the S&P 500’s 13.0%) means it now moves with, not against, systemic risk.
RELATED: Bull run or bear trap? Funding, flows, and macro headwinds
Bitwise CIO Matt Hougan controversially argues the “Crypto Winter” began in January 2025, masked by spot Bitcoin ETF outflows and inflows. If accurate, and if crypto winters historically last 13 months, the market may be approaching its final capitulation phase rather than beginning a prolonged downturn.
What Comes Next?
Short-term technical predictions and tools like the Fear and Greed index, while useful, shouldn’t be taken as final values, showing modest recovery potential: $73,043 by February 14 and $75,612 by March 1, 2026. Yet the path forward depends on which narrative prevails. Bulls point to flushed leverage and cleaned-out inefficient miners creating a foundation for recovery, with some 2026 average price targets reaching $171,263.
Bears warn that the Warsh era could bring prolonged liquidity drought, with Bitcoin facing sustained “chop” in the $50,000-$60,000 range or even testing $40,000-$50,000 if mining bankruptcies cascade. The cryptocurrency must consolidate losses and rebuild organic demand beyond mercenary institutional arbitrage before clearer directional signals emerge.
What’s certain is that the “supercycle” narrative is dead. Bitcoin has completed its transformation from an uncorrelated, idiosyncratic asset into a high-beta liquidity vehicle deeply integrated into traditional financial plumbing. It’s complete with CME derivatives dominance, Federal Reserve policy sensitivity, and structured product contagion vectors. The Bitcoin price drop shows that crypto is fully absorbed into the very system it was designed to escape.
Discover more from Web3Africa
Subscribe to get the latest posts sent to your email.
You must be logged in to post a comment.