










Table of Contents
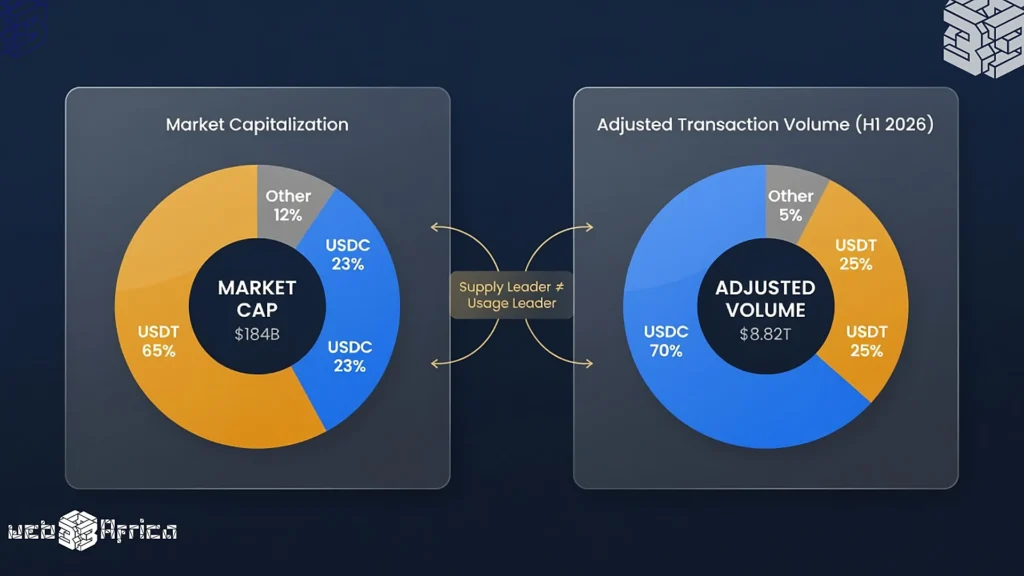
Tether’s USDT commands roughly 60–70% of the stablecoin market by supply. Circle’s USDC holds just 20–25%. Yet when measured by adjusted transaction volume, a metric designed to filter out bots, exchange rebalancing, and automated smart contract loops, the picture inverts completely.
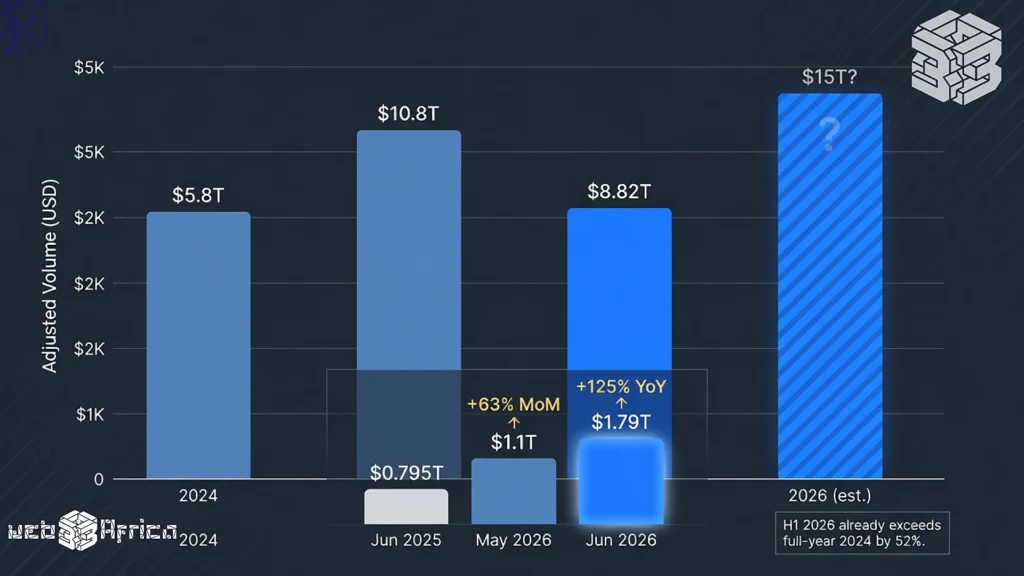
In the first half of 2026, USDC accounted for approximately 70% of adjusted stablecoin transaction volume, according to Visa Onchain Analytics.
USDT’s share? Just 25%.
This divergence raises a fundamental question for anyone evaluating stablecoin adoption metrics. What is the right way to measure adoption? And why do different measures produce such radically different conclusions?
What Market Capitalization Actually Measures
Market cap vs. transaction volume tells you how much stablecoin exists in circulation, with the total supply valued at its peg. It reflects trust, liquidity, and the willingness of users to hold an asset.
RELATED: The New Battle for Control Over Stablecoin Reserves
For USDT, a market cap exceeding $140 billion shows its role as the dominant store of value in crypto markets. It serves as digital cash, held in wallets, parked on exchanges, used as collateral, and stored as a hedge against volatility.
But market cap reveals nothing about usage. A stablecoin sitting idle in a wallet contributes to market cap without generating any economic activity.
What Adjusted Transaction Volume Measures
This is where on-chain data becomes critical, as the methodology used defines the metric.
Raw blockchain data captures every token transfer. This includes user payments, exchange treasury movements, high-frequency trading bots, DeFi arbitrage loops, and smart contract interactions. Visa processed an average of $1.4 trillion in payments volume per month in fiscal 2025 (totaling $16.7 trillion annually). When applying advanced risk filters, Visa blocks billions of dollars in fraudulent transactions annually.
Visa’s adjusted methodology removes:
- Transactions from addresses sending more than 1,000 transfers or $10 million in a 30-day period
- Labeled bot and MEV (maximal extractable value) activity
- Intra-exchange wallet rebalancing
- Redundant smart contract interactions
What remains is a proxy for genuine economic activity: payment settlement, cross-border transfers, DeFi lending, treasury operations, and B2B settlement.
McKinsey and Artemis Analytics found that of the $35 trillion in stablecoins moved on-chain in 2025. Only about $390 billion, roughly 1%, represented identifiable real-world payments like payroll, remittances, and B2B transactions.
The Missing Metric: Velocity
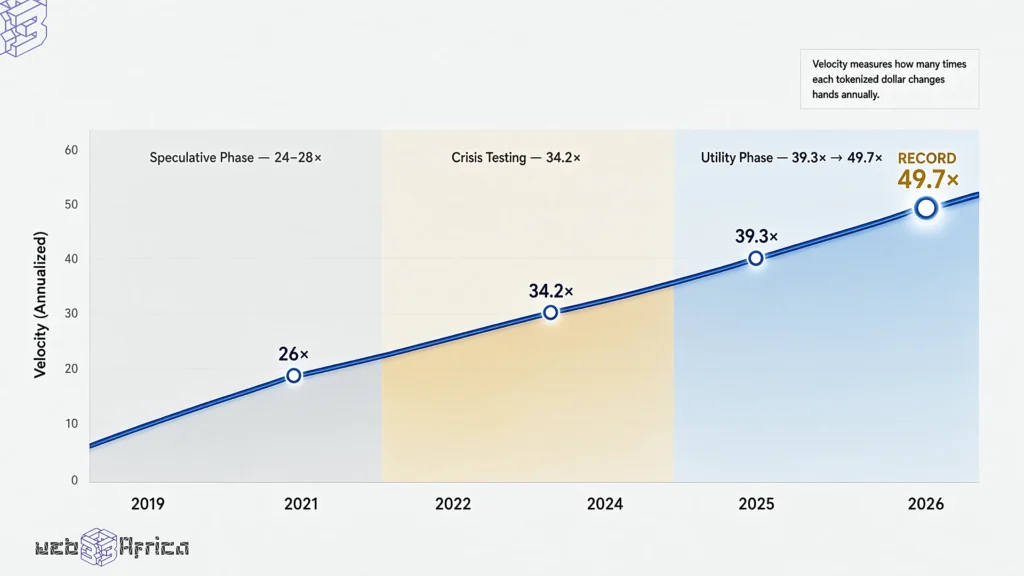
Stablecoin adoption metrics should include a third dimension: velocity.
RELATED: Why Stablecoin Adoption in Africa Ignores Virtual Cards
Velocity measures how many times each unit of stablecoin supply circulates annually. In 2026, stablecoin velocity hit 49.7×, according to analysis by DWF Labs and Allium. That means the average stablecoin dollar changed hands nearly 50 times per year, a rate comparable to traditional payment systems.
“Increasing velocity allows existing stablecoin supply to process more transactions without proportional market cap expansion.” JPMorgan
USDT’s high market cap and low velocity suggest it functions primarily as a store of value. USDC’s lower market cap but higher velocity and dominant share of adjusted volume indicate it serves as active payment infrastructure.
Cuy Sheffield, Visa’s Head of Crypto, framed it clearly:
“Market cap is a measure of trust and liquidity, but adjusted volume is a measure of utility.”
Why Institutions Are Building Around Usage Instead of Supply
The institutional adoption pipeline reflects this shift toward payment settlement rather than passive holdings.
BNY Mellon, the world’s largest custody bank with $59 trillion in assets under management, made USDC the first stablecoin supported on its Digital Asset Custody platform. Standard Chartered became the first Global Systemically Important Bank to enable institutional clients to mint and redeem USDC directly through the bank.
Stripe, after its $1.1 billion acquisition of the stablecoin orchestration network, has made significant advancements in the digital payments space. Bridge reported that 18% of its cross-border small-merchant payout volume now settles via USDC, citing a 90% reduction in settlement fees compared to SWIFT.
Circle’s Payments Network, integrated with Nium’s global payout infrastructure, recorded $8.3 billion in annualized transaction volume as of March 2026, providing access to payouts in over 190 countries and 100 currencies.
None of these institutions built around USDT. They built around the stablecoin, demonstrating the highest adjusted usage.
The Quiet Reversal
In 2020, USDT accounted for roughly 90% of adjusted transaction volume. USDC held less than 10%. By 2022, USDC’s share had climbed to 45%. In H1 2026, it reached 70%.
RELATED: Mastercard x MoonPay: Stablecoin Cards for Africa’s Unbanked
Stablecoin analytics firm Artemis described the phenomenon as the “Quiet Flippening,” a reversal in which the usage leader and the supply leader are no longer the same asset.
Retail-sized transactions provide additional evidence of mainstream migration. Visa’s data shows that retail-sized volume represents just 0.6% of total adjusted volume. Retail-sized transactions account for 57% of transaction count, the classic signature of consumer payments. Many small purchases occur, rather than a few large ones.
A Better Framework for Measuring Stablecoin Adoption
No single metric captures adoption completely. Researchers, investors, and analysts need a multi-indicator approach:
- Market capitalization measures supply and trust, how much stablecoin exists, and how willing users are to hold it.
- Adjusted transaction volume quantifies economic activity by assessing the active use of stablecoin for settlement, payments, and value transfer while filtering out automated noise.
- Velocity measures circulation speed, how many times each dollar turns over annually, indicating whether the asset functions as infrastructure or storage.
- Transaction count (especially retail-sized) measures breadth of adoption, or how many individual payments are occurring, rather than total dollar volume.
- Network concentration measures where activity occurs and which blockchains host the majority of settlements, revealing cost and speed preferences.
Why Future Stablecoin Growth Will Be Defined by Utility
Regulatory clarity is accelerating the divergence. The passage of the GENIUS Act in the United States established a federal framework for dollar-backed stablecoins, giving institutions the regulatory confidence to integrate stablecoin infrastructure without ambiguous compliance risk.
USDC gains a significant advantage from rules that promote openness and high compliance standards because it has more regular public checks and aligns closely with U.S. regulatory expectations.
As banks, payment firms, and fintech companies expand blockchain-based settlement infrastructure, the metric that will matter most is not which stablecoin has the largest supply, but which one moves the most value with the greatest frequency.
Understanding how to measure stablecoin adoption means recognizing that market cap, transaction volume, and velocity answer fundamentally different questions. The stablecoin that dominates holdings may not dominate payments.
FAQ
Why is market capitalization not enough to measure stablecoin adoption?
Market capitalization reflects how much stablecoin supply exists and how willing users are to hold it, but it does not show whether those assets are actively used for payments or settlement.
What does adjusted transaction volume measure?
Adjusted transaction volume filters out bot activity, exchange wallet rebalancing, MEV transactions, and redundant smart contract interactions to better represent genuine economic activity on-chain.
How does stablecoin velocity help measure adoption?
Velocity measures how many times each unit of stablecoin supply circulates over a year, indicating whether a stablecoin primarily functions as payment infrastructure or as a store of value.
Discover more from Web3Africa
Subscribe to get the latest posts sent to your email.
You must be logged in to post a comment.